Member-only story
Interactive Infographic Using SVGs & Vue.js
What you’re getting into: A detailed tutorial on describing the process of making an interactive infographic using SVGs and Vue.js. This is going to be more advanced than other posts, however, it is written in a fashion to be as clear as possible. While not an exhaustive start to finish tutorial for the sake of time, it is still a great guide for learning how to get started with interactive infographics.
Final demo: http://codepen.io/mikemang/pen/KWaqbv
I’d rather watch the video: https://youtu.be/dUqSb4Pd6vo
(Update 3/27/17): I have begun the process of creating a video course for providing a very clear and detailed break down of SVGs. I will cover explaining SVGs “under the hood”, using Affinity Designer to create detailed vector graphics, animation with CSS, GreenSock, Mo.js, and Anime.js, as well as some practical applications of UX animations. You can book access here.
What is an infographic?
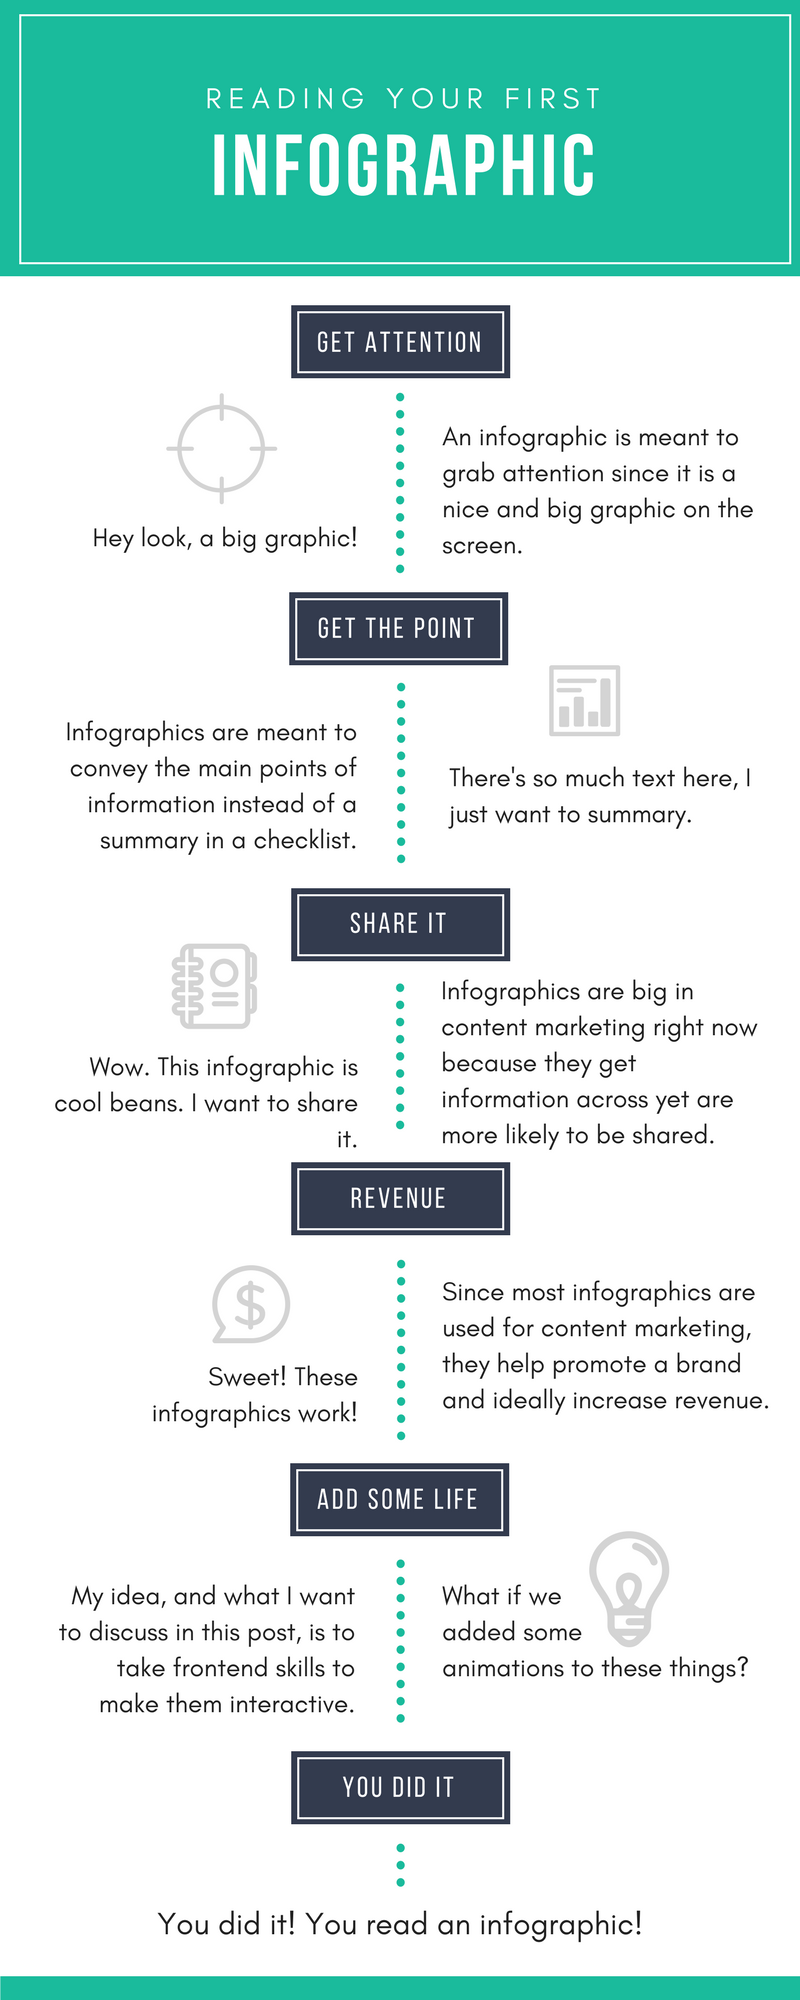
Now, you understand what an infographic and what I want to do in this post.
In this post, I want to demonstrate a real-world application of using CSS, SVGs, and Vue.js…

